Defining Home Pages with a Text Editor
Process Metric Scorecard Panel
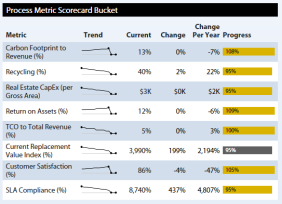
This type of panel charts presents all of the Archibus metrics assigned to a particular scorecard. These metrics must be "Displayed" rather than "Hidden" on the Archibus Metric Scorecard Assignments (afm_metric_scards) record to display.
A typical descriptor for a process metric scorecard is:
<bucket
title="Process Metric Scorecard Bucket"
tooltip="Key-performance indicators."
type="app-specific"
controlType="processMetrics"
columnSpan="2"
scorecard="BALANCED_SCORECARD"
granularity="all"
useStoplightColors="true"
/>
controlType. A value ofprocessMetricsspecifies that the home page should invoke the process metric scorecard control with the other attributes listed as parameters.columnSpan. Instructs the page home to let this control span two columns.scorecard. The Scorecard Code (afm_metric_scards.scorecard_code) assigned to all the metrics that should be displayed.granularity. The Archibus Metrics Framework collects metrics at different levels of granularity, e.g.allfor portfolio wide,bu_idfor Business Unit, etc. This attribute instructs the control to display a different level of granularity. For instance, if you had a virtual-private Archibus restriction on Business Unit, and you set the granularity to Business Unit, then each business unit manager would see only the process metric values for their own business unit.useStoplightColors.- The horizontal bar chart shows bars in a color other than the default dark gray under two cases:
- The panel's
useStoplightColorsproperty = 'true' AND thestoplightColorvalue is NOT 'black'. When the panel'suseStoplightColorsproperty = 'false' or is undefined OR thestoplightColorvalue = 'black', then the bar will be shown in the dark gray color . The metrics service workflow rule assigns the stoplight color based on its internal specifications. - The panel's
useStoplightColorsproperty = 'false' or is undefined AND the bar value is negative. When the panel does not use stoplight colors and the bar value is negative, the bar is given the CSS class of 'neg' which shows red using most class files. In the first use case of the problem description, theuseStoplightColorsproperty is false and the first bar's value is negative.
- The panel's
- If
true, the control will display the progress bar as:- green if the metric is within its target boundaries
- yellow if the metric is over its warning limits
- red if the metric is over its critical limits.
- The horizontal bar chart shows bars in a color other than the default dark gray under two cases: